Why Batteries Change the Math for Solar in Poland
Co-located BESS lifts solar revenue by up to 61% and sharply reduces day-to-day volatility. A data-driven look at what storage actually does for PV economics and bankability in the Polish power market.
A representative 1 MWp of installed solar capacity in Poland — covering both utility-scale and prosumer installations, calculated from actual generation and prices reported by PSE against total installed capacity — earned 230 kPLN in market value over 2025. The same megawatt-peak, with a co-located battery, earned 342 kPLN. Same panels. Same grid connection. Same sunshine. Just better timing.
That 49% gap is the starting point for everything I discuss below. As I showed in my analysis of PV capture factors, Poland’s solar fleet now exceeds 23 GW and the capture factor — the share of the average wholesale price that PV generators actually receive — has been falling toward 50% in peak summer months. The same megawatt-hours are worth less every year, and the trend is accelerating.
The diagnosis is familiar: too much solar output arrives in the same midday window, pushing prices down precisely when PV is producing. I think co-located battery storage is the most practical lever an individual asset owner has to fight back — not as a system-level fix, but as a way to defend project economics right now.
Re-timing the same energy
The mechanism is straightforward. A battery paired with a PV plant stores part of the midday output — when prices are depressed — and discharges it in the evening, when the sun has set, demand is still high, and prices recover. The plant generates the same total energy; it just sells it at better times.
I simulated a representative 1 MWp PV asset through 2025 using actual market prices, with a deliberately simple battery dispatch: each day, shift energy from the two cheapest hours into the two most expensive hours. No intraday trading, no optimisation. Just basic arbitrage.
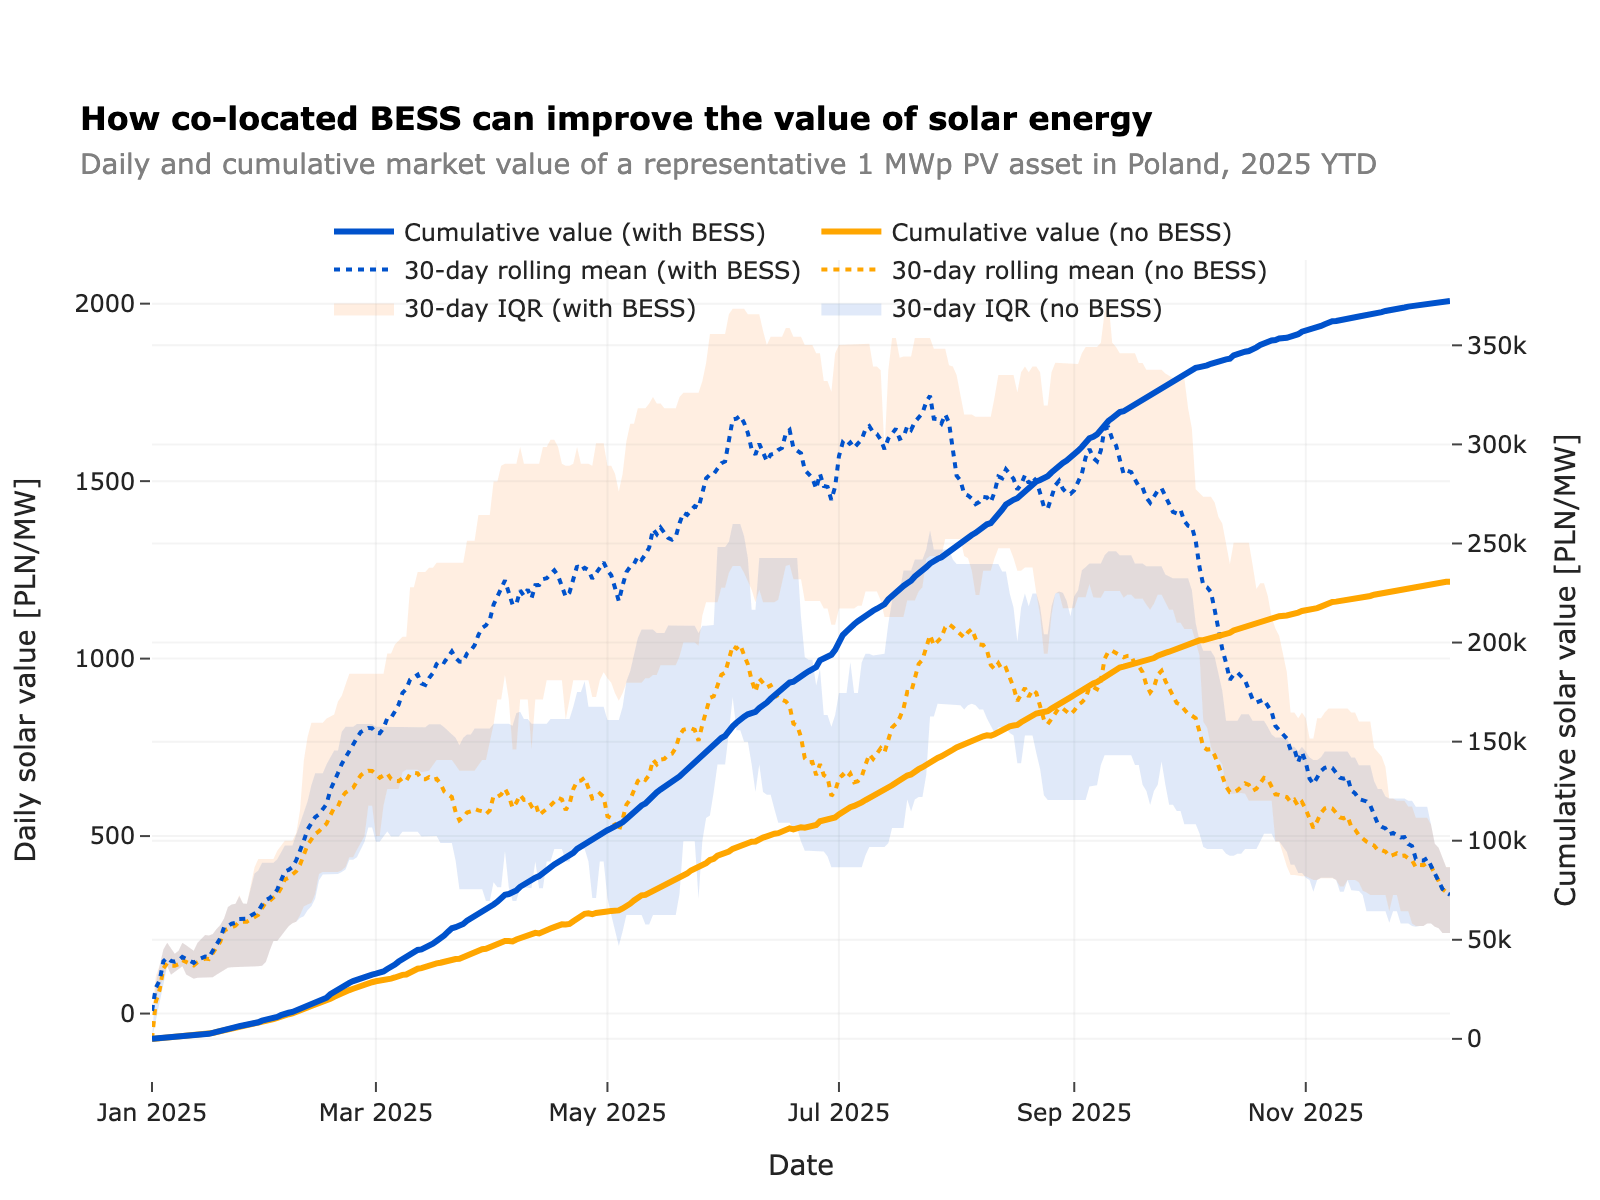
The two cumulative curves diverge steadily as the year progresses — 230 kPLN/MWp without a battery, 342 kPLN/MWp with one. The gap widens most through the summer months, when midday price suppression is most severe and the battery has the most room to shift value.
What a single day looks like
Take June 17, 2025. The chart below shows the PV generation profile, the battery-adjusted dispatch, and the real-time market price on that day.
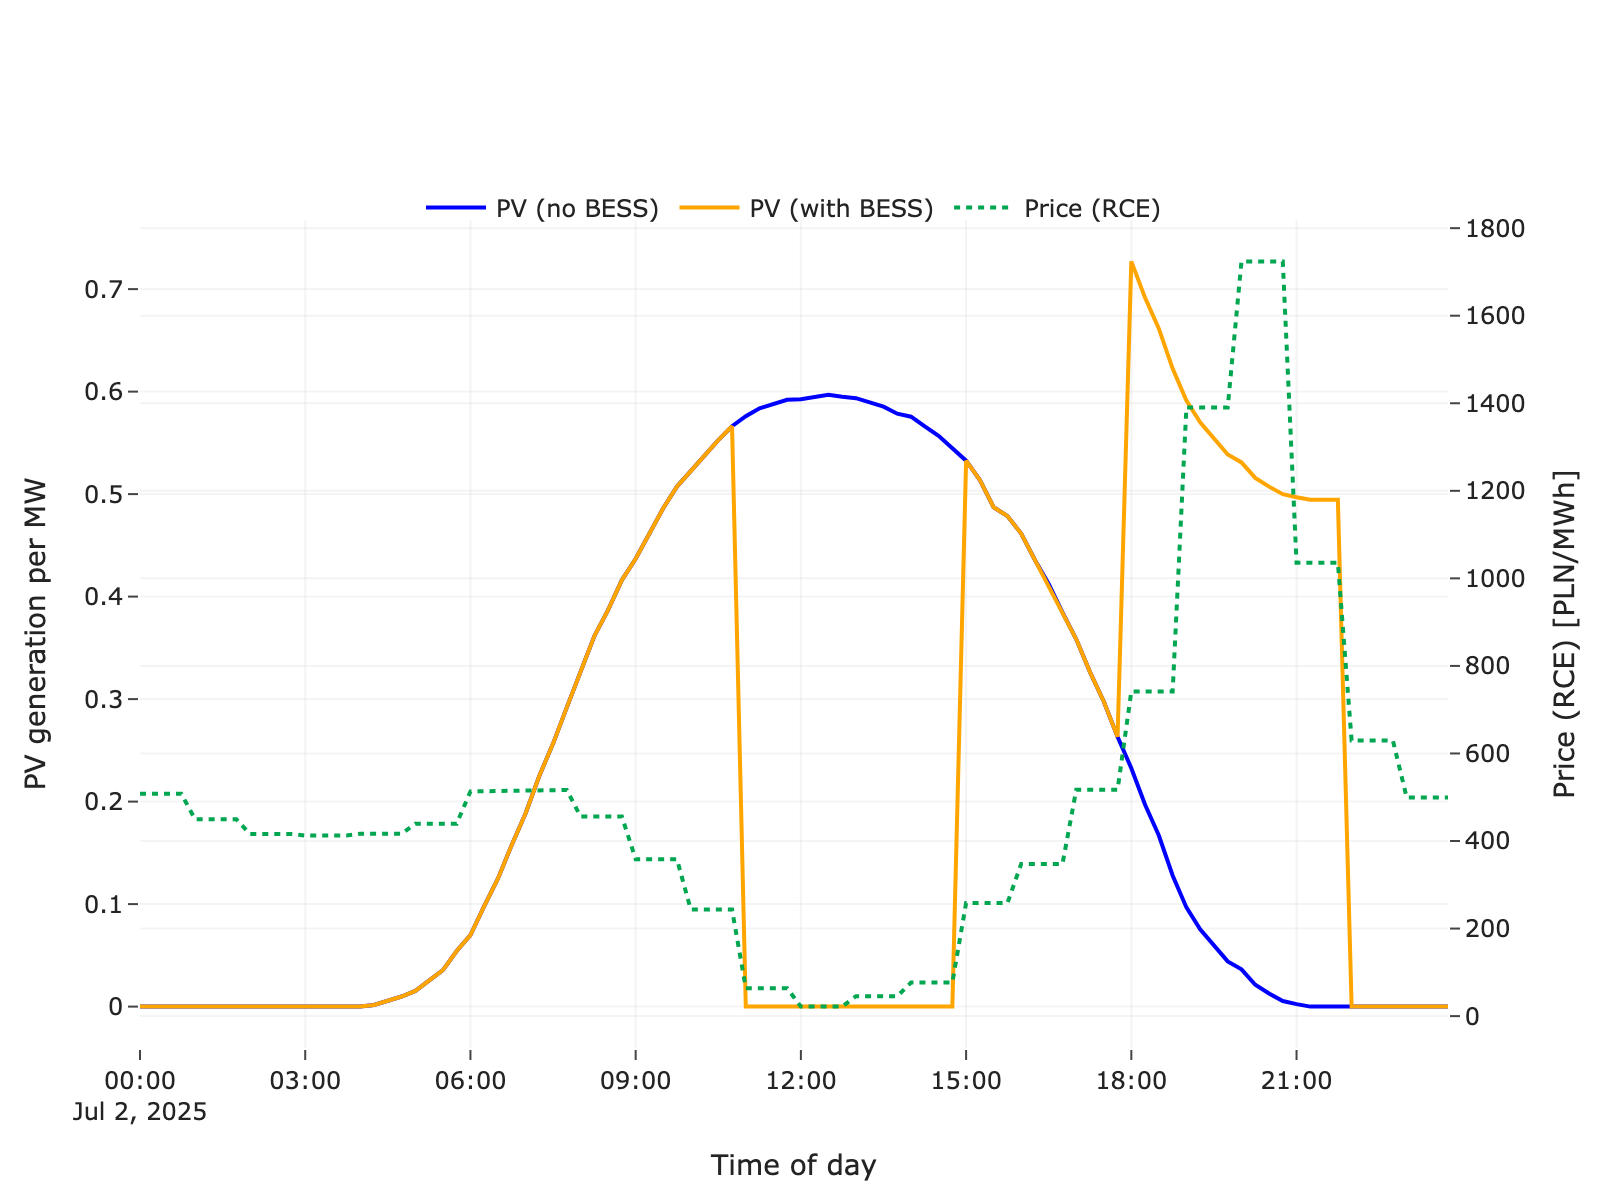
Without the battery (blue), the plant dumps its entire output into hours where the market price approaches zero. With the battery (orange), that midday energy is absorbed and released in the evening when prices spike above 1,000 PLN/MWh.
This is not a cherry-picked day. The pattern repeats on most sunny summer days in Poland: midday oversupply crushes prices, evening scarcity lifts them. The battery simply rides that daily shape.
More predictable, not just higher
Higher average revenue is good. But I think the second effect matters even more: predictability.
Lenders care about the downside. Equity investors need to model cash flows with confidence. A volatile revenue stream — even one with a decent mean — is harder to underwrite. The scatter plot below maps each day’s total PV output against the revenue it earned, with and without storage.
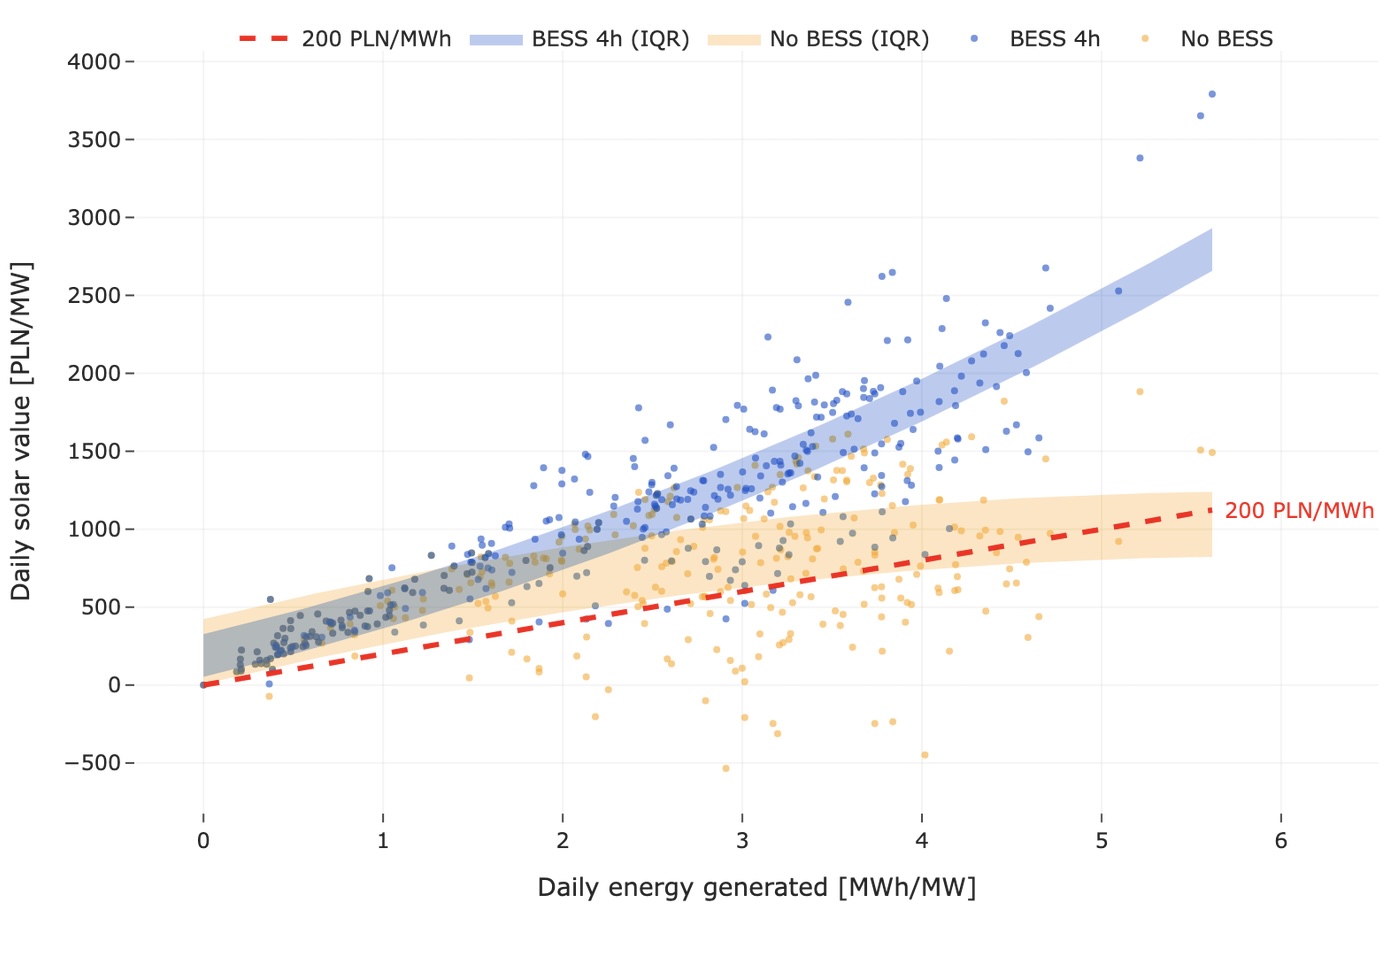
Look at the orange cloud (PV only). It is wide and messy. On days with similar generation, revenues scatter across a broad range — some high-output days produce decent returns, others deliver very little or even negative value. The relationship between “how much you generate” and “how much you earn” is loose and unreliable.
Now look at the blue cloud (PV + BESS). Tight and steep. More energy almost always translates into proportionally more revenue. The low-value tail is largely gone. Days that would have earned below 200 PLN/MWh without storage are consistently pulled above that threshold.
The average daily value per MWh shifts from 280 PLN/MWh (PV only) to 453 PLN/MWh (PV + 4h BESS) — a 61% increase. But I think the tighter spread around that mean is the more important number. It means the asset’s cash flow profile moves from “high variance, hard to model” to “steeper, more linear, bankable.” That translates directly into better financing terms: higher debt capacity, lower cost of capital, and a more favourable risk assessment from lenders who have seen too many solar revenue projections miss their P90 cases.
What the battery does not fix
A co-located battery helps an individual asset defend its revenue. It does not solve system-wide cannibalization. If every PV plant in Poland added a battery and shifted output to the same evening hours, the evening price peak would eventually flatten too — just as the midday peak collapsed under solar volume.
My simplified dispatch strategy — shifting from the two cheapest to the two most expensive hours — also understates what a well-operated battery can do. In practice, a battery can stack value through day-ahead and intraday market trading, balancing services, frequency regulation, and capacity market participation. The 49–61% uplift I describe is a conservative floor, not a ceiling.
On the other hand, my analysis uses perfect foresight on daily prices. A real battery operator faces forecast uncertainty, degradation, and round-trip efficiency losses. The net result sits somewhere between my simplified floor and the theoretical maximum — but the direction and magnitude of the effect hold up clearly in the data.
The investment case
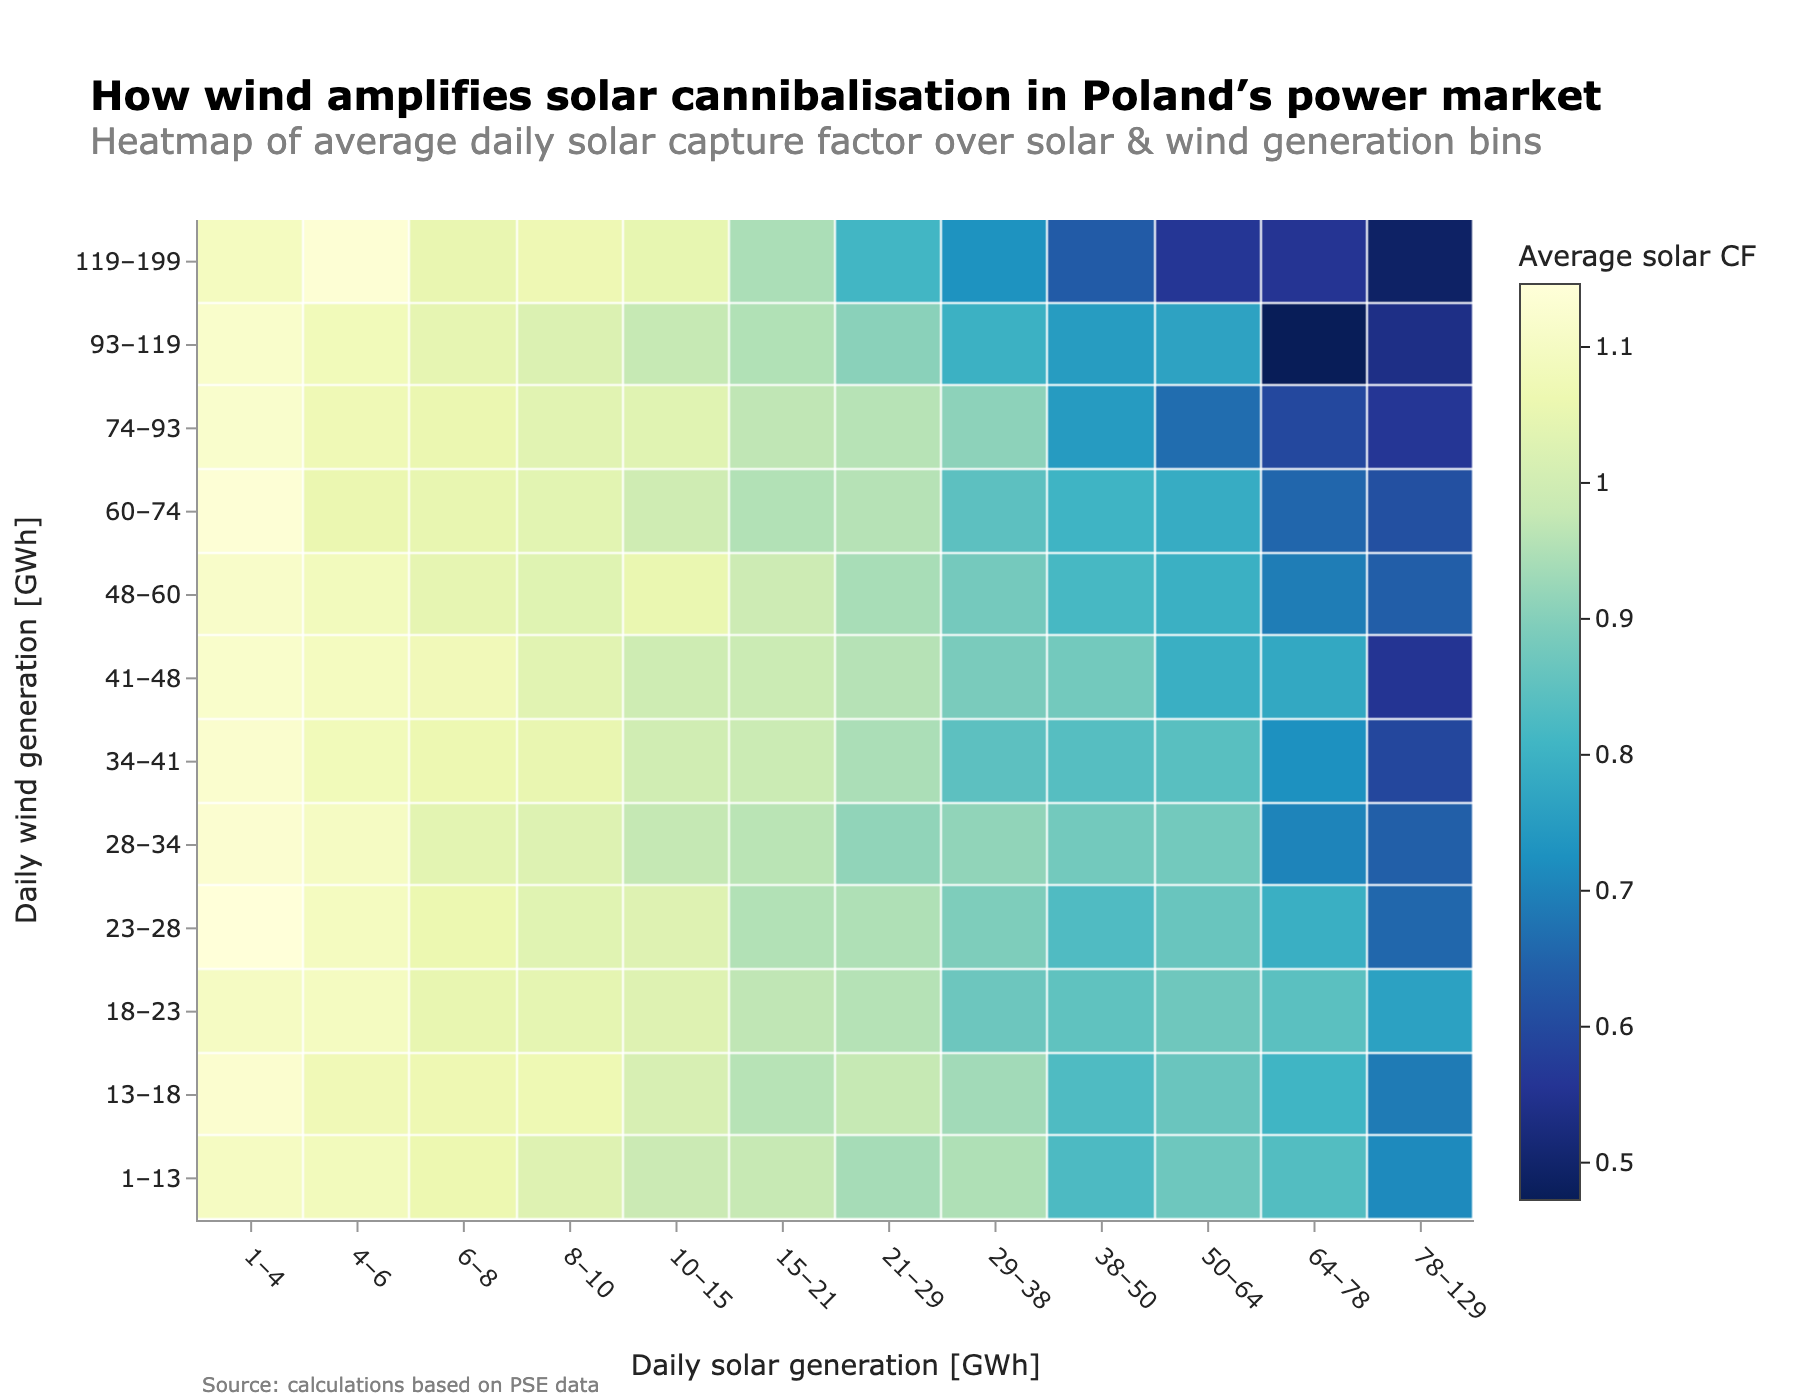
Poland is adding PV capacity at a pace that will continue to compress capture factors. As I showed in my analysis of how residual load shapes prices, the relationship between renewable output and wholesale prices is non-linear — each additional GW of solar pushes midday prices down further, and the capture factor erosion accelerates.
In that environment, I believe co-located storage is becoming less of an optimisation and more of a prerequisite for new PV projects that need to secure financing. The 2025 numbers make the case: +49% cumulative captured value over a full year with a simple dispatch strategy, +61% average daily value per MWh, and sharply reduced revenue volatility that makes the asset profile suitable for debt financing.
These are not marginal improvements. For a market where solar capture factors are heading toward 50%, a battery that lifts effective capture back above 75–80% is the difference between a project that pencils out and one that does not.
The first wave of Polish solar was about volume. The next wave will be about making that volume bankable — and storage is the most direct path to get there.
More posts
Solar Cannibalization in Poland: How Capture Factors Erode as Renewables Scale
Solar capture factors in Poland have fallen below 50% in peak months — and the decline accelerates with penetration. A two-dimensional look at how both solar volume and wind output shape PV revenues, and what the curve ahead looks like.
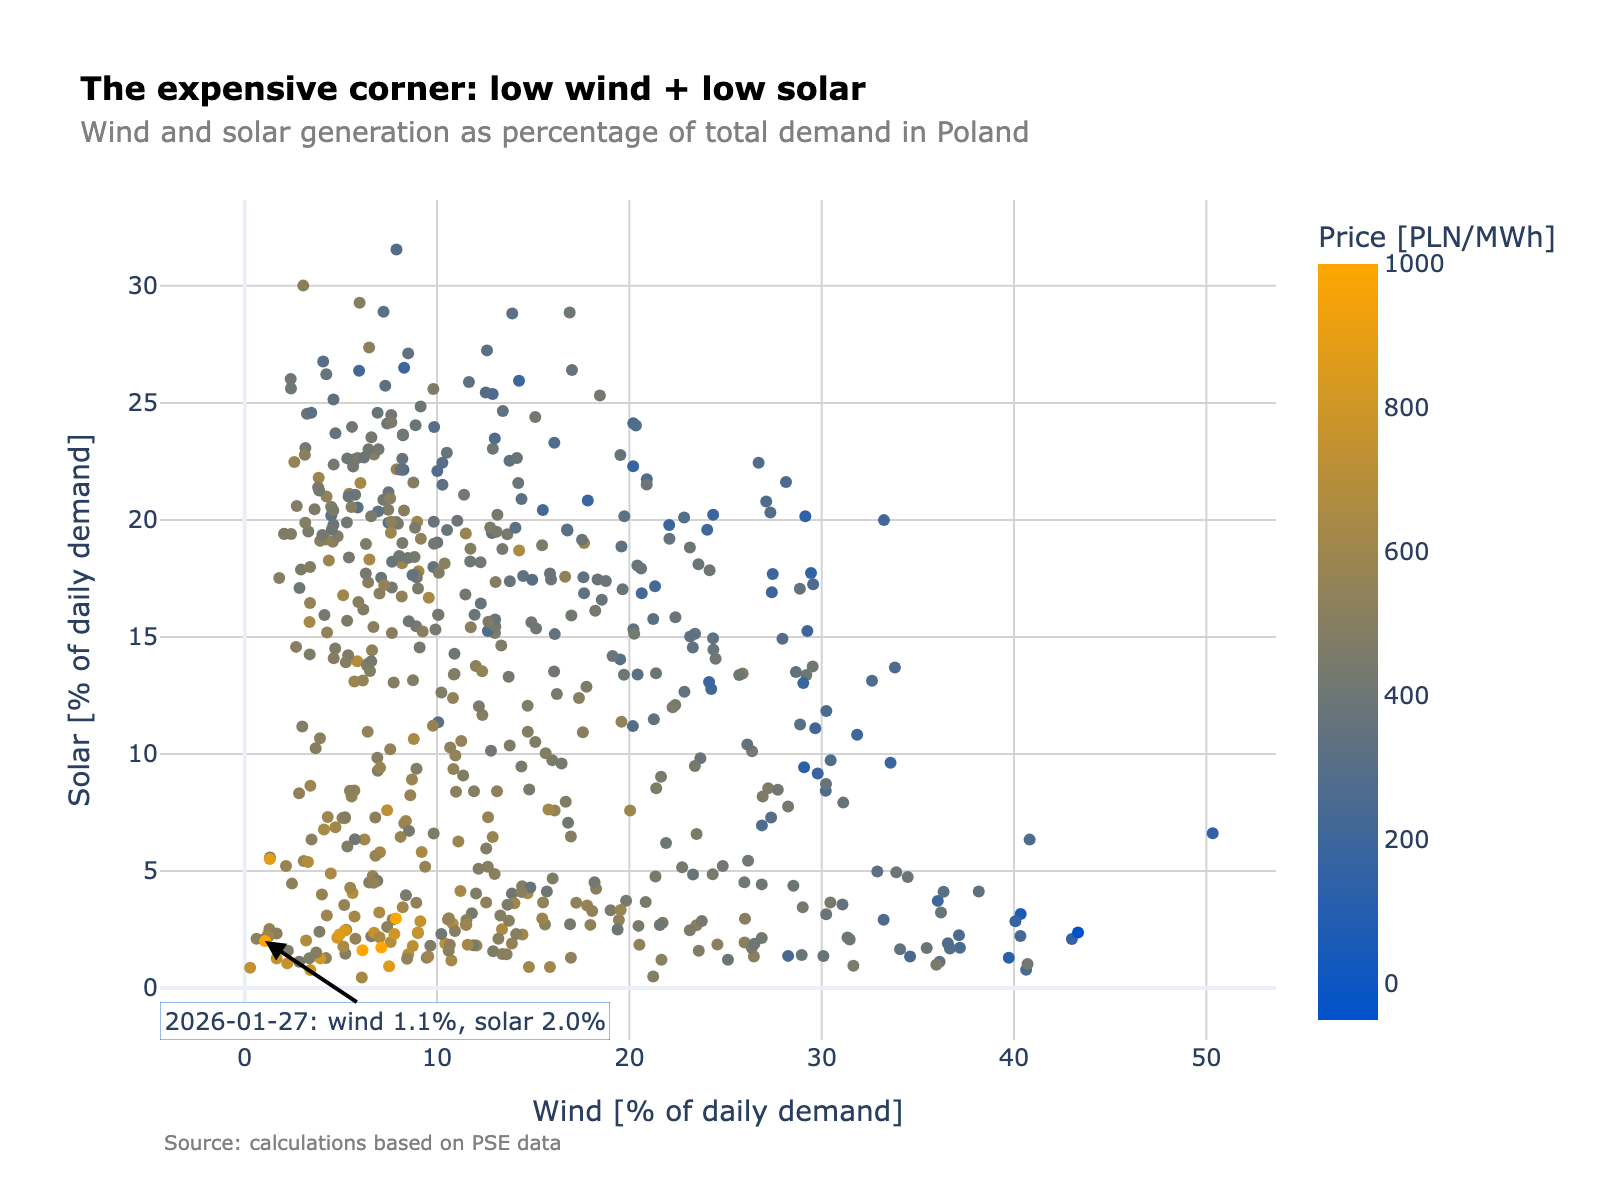
When Wind and Sun Both Disappear: Joint Renewable Scarcity and Prices in Poland
Days with low wind and low solar are not rare — they are a recurring regime in Poland that drives the highest wholesale prices. Residual load, not total demand, is the real scarcity signal.
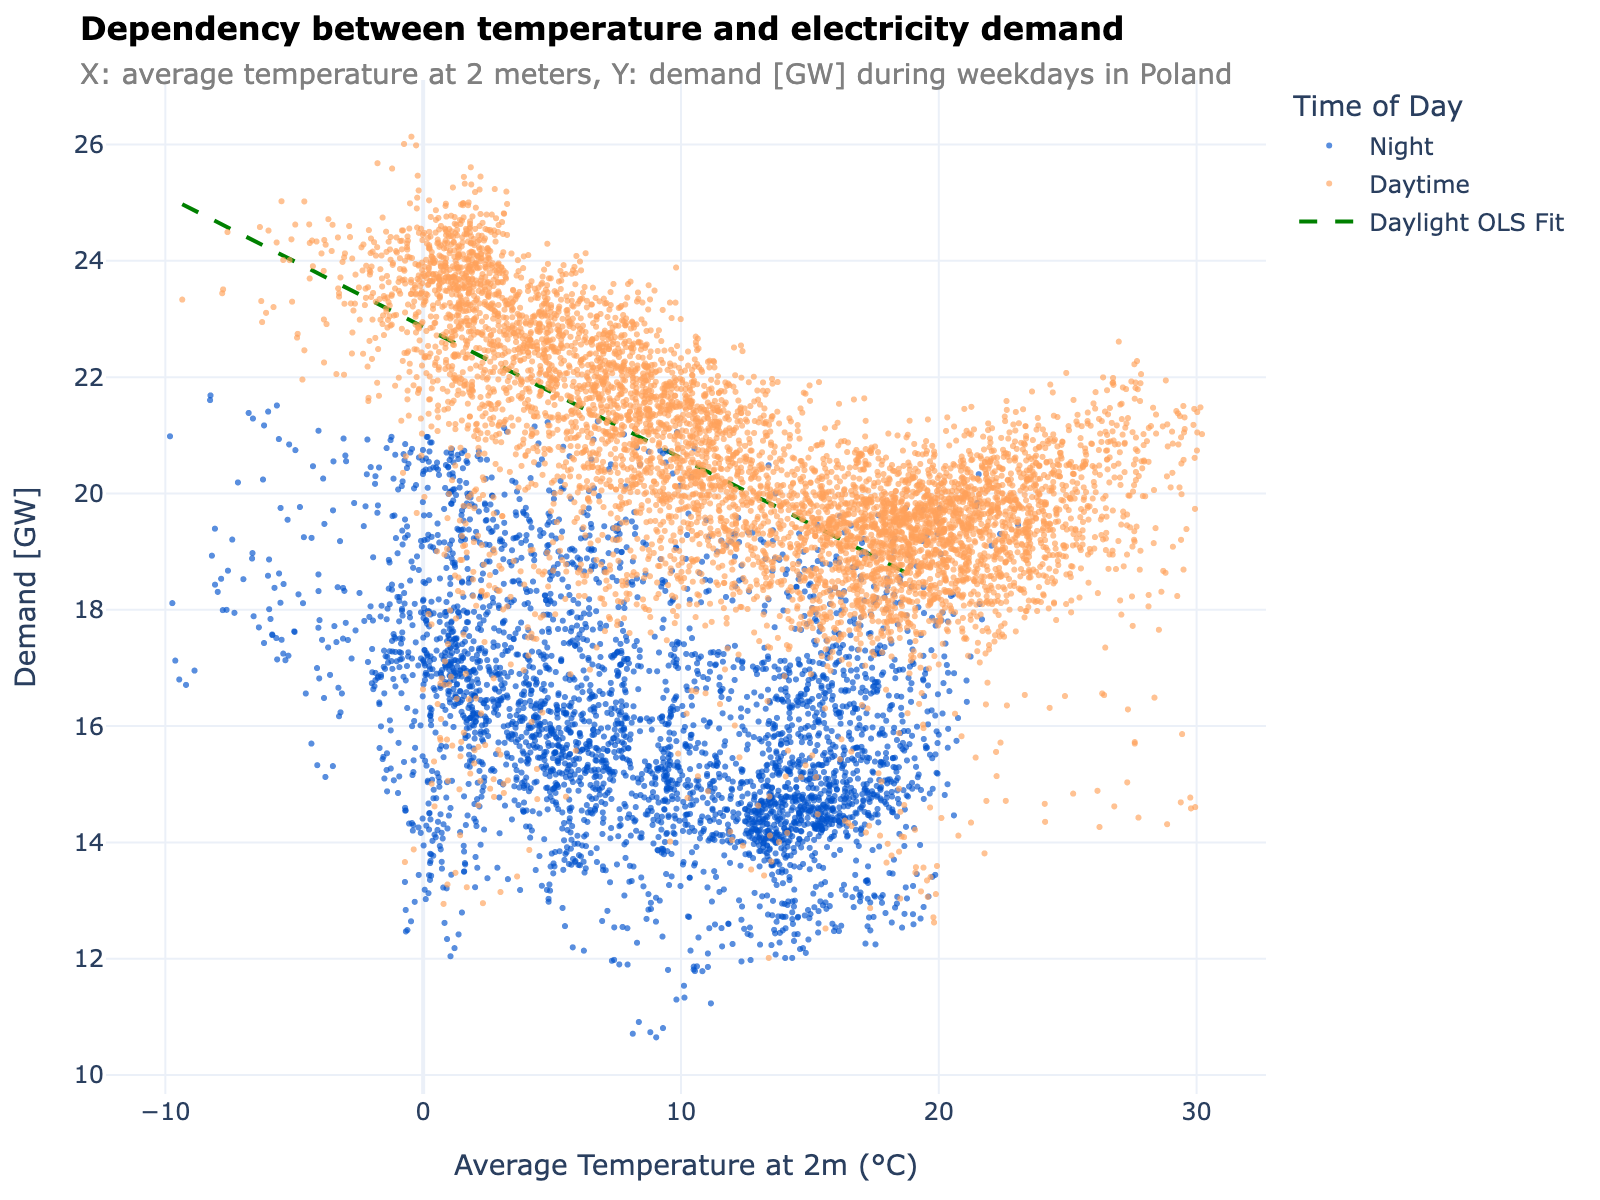
Poland's Electricity Demand: What Temperature and Ramps Tell Us About System Stress
Electricity demand in Poland follows a clear temperature curve with a comfort minimum around 19°C. But peak load is only half the story — residual-load ramps exceeding 4 GW per hour reveal where real system flexibility is tested.