
·
What actually happens when Poland triggers a capacity market call
Poland's capacity market (rynek mocy) was called three times in the summer of 2026 — more than in the previous five years combined. I reconstruct the capacity market call trigger PSE publishes, compare the three call days with similarly stressed days on which no call was declared, and show which factors actually drove the margin shortfall.
TL;DR
- Poland’s capacity market has been called 5 times since delivery began in 2021 — three of those calls occurred in a single summer, covering a total of 11 hours in 2026. The longest lasted five hours, from 17:00 to 22:00 on 6 August.
- Within the capacity obligation window, the called hours generally coincided with the lowest forecast margins. At the first called hour on 30 June, 4 August and 6 August, the forecast margins known as of 06:00 on the day of the call were −1,071 MW, −775 MW and +32 MW, respectively.
- The drivers of the margin shortfall differed across the three call days. On 30 June, the main pressure came from high demand and low wind generation, while 4 and 6 August had substantially more capacity unavailable because of planned outages and operating-condition deratings.
Poland spent the summer of 2026 discovering that its power system can become tight in August. On 30 June, 4 August and 6 August, PSE declared a capacity market call — okres przywołania na rynku mocy — a period during which capacity providers are required to meet their adjusted capacity obligations. Before this summer, the mechanism had been invoked only twice since capacity market delivery began in 2021.
What a capacity market obligation actually means
The capacity market is a mechanism designed to ensure that sufficient capacity is available to meet demand. It was introduced in Poland in 2021, with capacity procured through a series of auctions. Providers are paid for availability rather than for energy itself: in exchange for a fixed payment per kilowatt, they take on a capacity obligation — a commitment to be available during specified hours — and a capacity market call activates that obligation. Generating units, energy storage and demand-side response (DSR) units can all participate, with their capacity certified according to the rules of the mechanism.
There are two quantities worth distinguishing when discussing these obligations:
- Contracted obligation — the capacity each provider sold at auction for the delivery year. Summed across the market, it stood at 25.4 GW in August 2026.
- Adjusted obligation — the capacity each provider is required to provide during a call. Contracted obligations are adjusted according to system conditions, so the obligation during a particular called hour can differ from the provider’s contracted capacity.
Five calls in five years, three in one summer
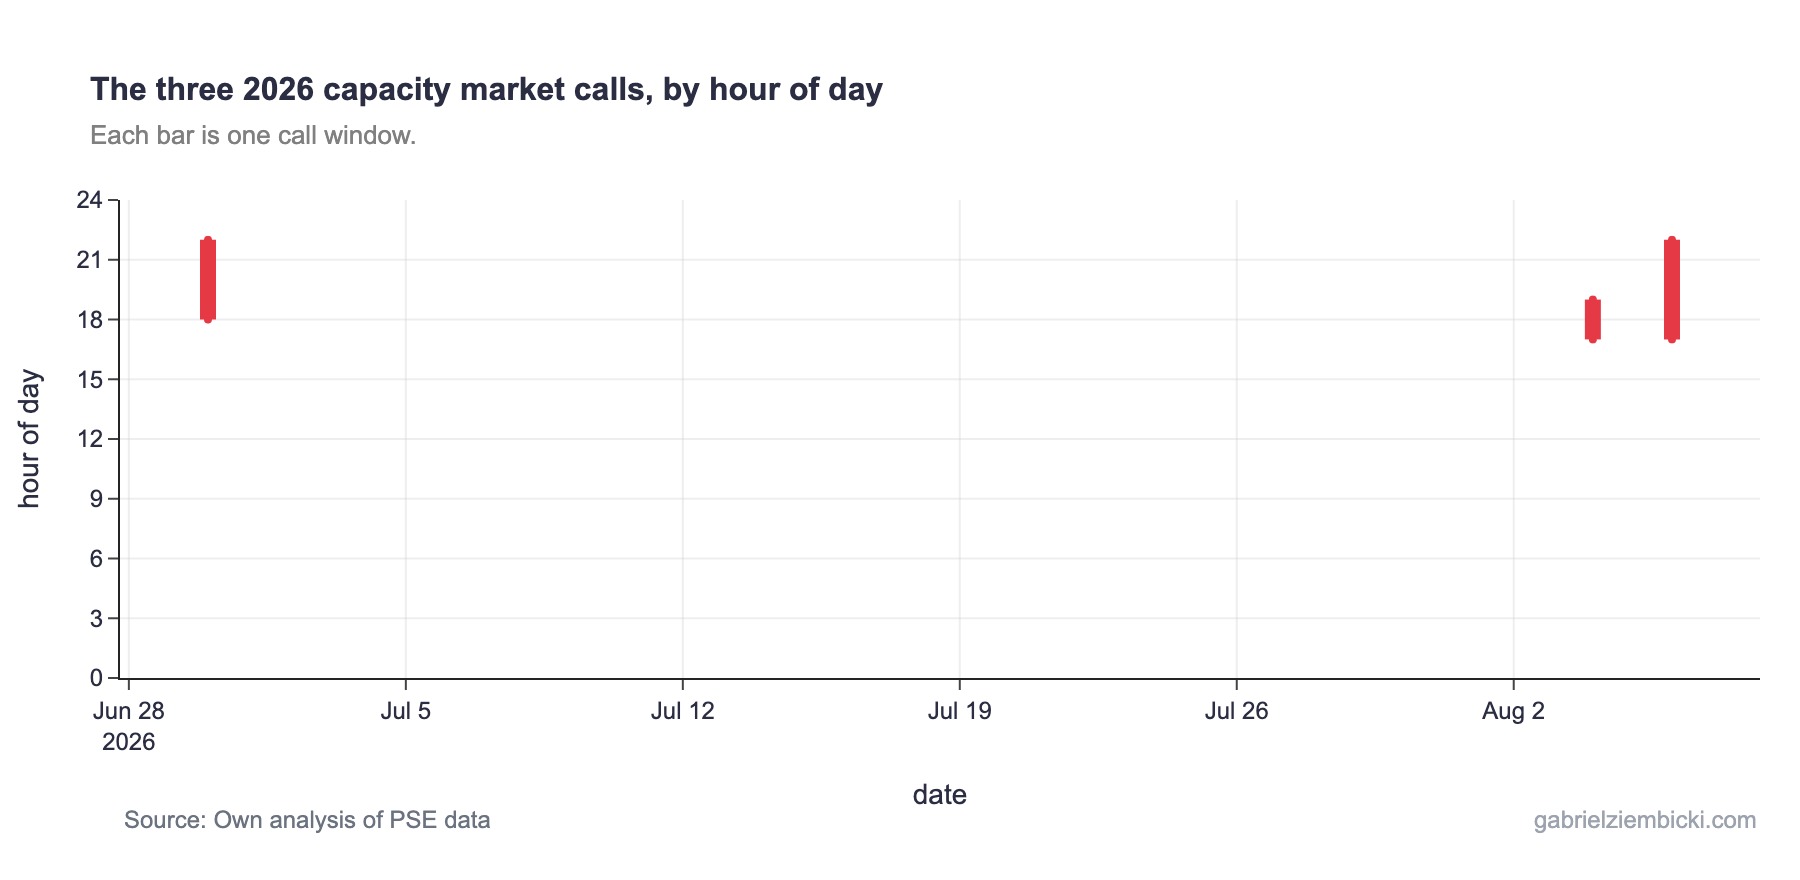
The rest of this post focuses on the three calls declared in 2026:
| Date | Hours (local) | Duration |
|---|---|---|
| 2026-06-30 | 18:00–22:00 | 4 h |
| 2026-08-04 | 17:00–19:00 | 2 h |
| 2026-08-06 | 17:00–22:00 | 5 h |
All three occurred in the evening. None was declared during a winter morning peak, even though winter is when the Polish system has historically experienced its highest loads. This is the first indication that capacity calls are driven not by demand alone, but by the relationship between demand and available capacity.
How PSE decides: the capacity market call trigger
Formally, a capacity market call is triggered when, during daily balancing or following an update to the daily balance, PSE determines that the surplus of total net capacity available to the operator is lower than the required reserve. For the D and D+1 horizons, the regulation sets that reserve at no less than 9% of the planned demand to be covered by domestic generation; higher percentages apply to longer horizons.
PSE publishes, for every hour, the available capacity of units providing balancing services, how much of that capacity is available to the TSO, forecast generation from units outside the balancing fleet, demand, cross-border exchange and the required reserve. The surplus can be expressed as:
| Symbol | Meaning |
|---|---|
| Capacity surplus available to the TSO | |
| Balancing fleet capacity available to the TSO | |
| Forecast generation from units and storage not providing balancing services | |
| Forecast net grid demand | |
| Planned cross-border balance, with imports positive |
Demand adjusted for cross-border exchange and generation outside the balancing fleet gives the amount that must effectively be covered by the balancing fleet. The surplus can therefore be understood as the capacity available to the TSO beyond what is needed to meet that requirement.
A call can be triggered when this surplus falls below the required reserve. Equivalently, the margin — the surplus above the required reserve — becomes negative:
There is also a 1,100 MW exception. The regulation allows PSE to refrain from announcing a call when the surplus is at least 1,100 MW and PSE determines that meeting demand is not threatened. This creates three useful zones for interpreting the published data:
- No call condition: .
- Discretionary zone: — PSE may refrain from declaring a call if it determines that demand coverage is not at risk.
- Call condition: and .
The capacity obligation itself applies only on weekdays between 07:00 and 22:00. The obligation field is populated at 25413 MW inside that window as of August 2026 and is zero overnight and at weekends. A tight hour at 02:00, therefore, cannot become a capacity market call.
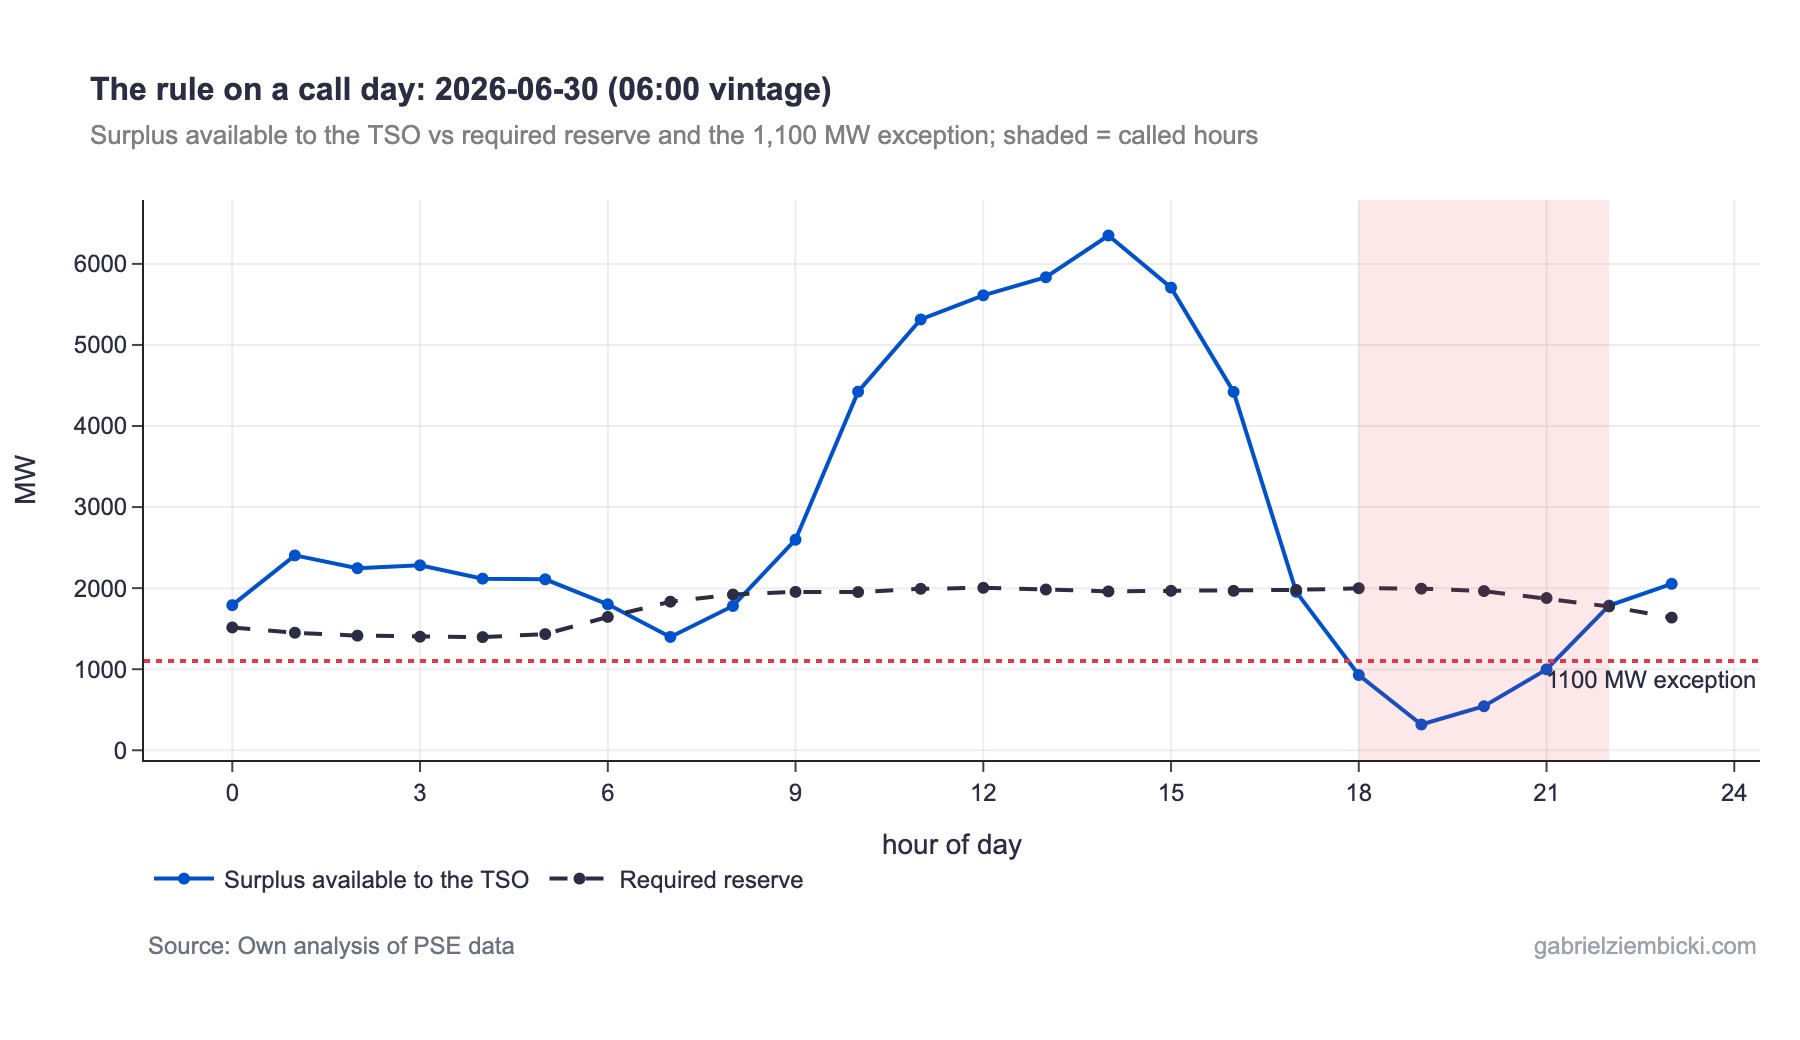
The example of 30 June shows the clearest case. The forecast surplus fell well below both the required reserve and the 1,100 MW exception threshold. PSE declared a call, consistent with the formal condition.
That is the rule on paper. Comparing the forecasts available earlier in the day with the eventual call windows, however, shows that what was known as of 06:00 does not on its own always explain the precise hours selected. The next section looks at what was known before each call and how those forecasts compare with the hours that were ultimately called.
What PSE’s forecasts showed before each capacity call
PSE evaluates the system using forecasts rather than realised values, so the relevant question is what the system was expected to look like before each call. The three panels below show the forecast margin above the required reserve for each 2026 call day, using the last plan published before 06:00 on the day of the call. The eventual called hours are shaded.
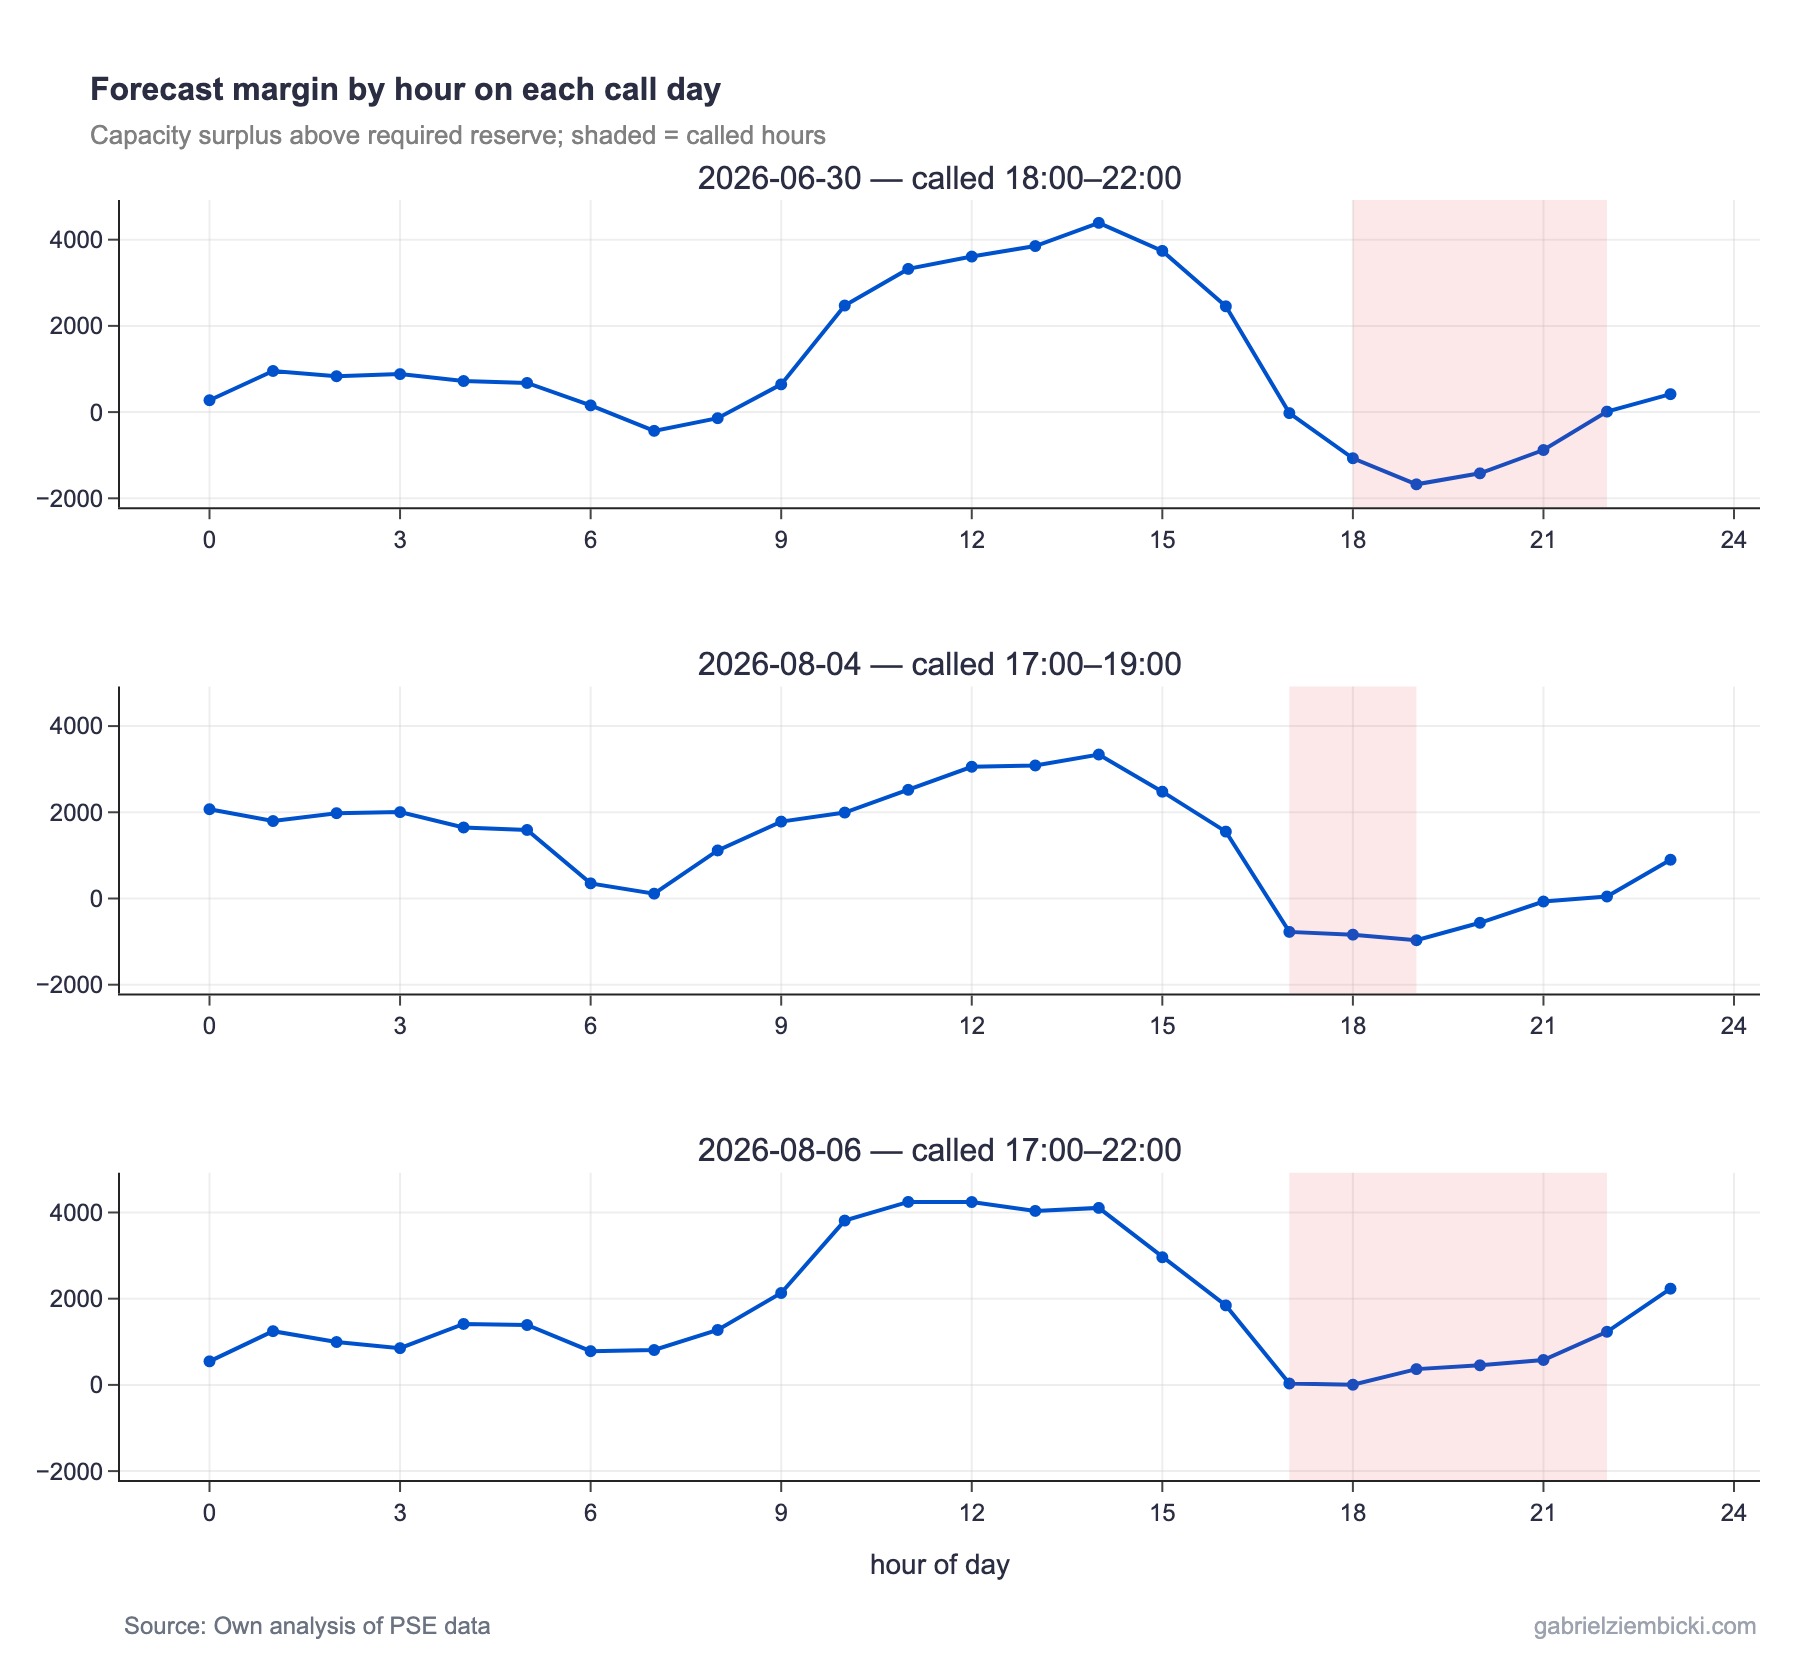
Figure 3 shows a similar intraday shape on all three call days: a comfortable margin of roughly 2,000–4,000 MW around midday, when solar output is high, followed by a steep decline into the evening. Every call coincides with the lowest-margin part of the day.
On 30 June, the margin falls below zero at 18:00 and reaches approximately −1,700 MW at 19:00; PSE called the period from 18:00 to 22:00. On 4 August, the margin is negative for five consecutive hours, from 17:00 to 22:00, yet PSE called only 17:00–19:00. On 6 August, the margin falls to around zero at 17:00 and 18:00 before gradually recovering, yet PSE called the full period from 17:00 to 22:00.
The 6 August event shows particularly clearly that the margin known as of 06:00 does not by itself explain the exact call window. In the last plan published before then, only 17:00 and 18:00 were close to the threshold. From 19:00 to 22:00, the surplus exceeded the required reserve by 366–578 MW. Nevertheless, PSE called the entire five-hour block. This could reflect later forecast revisions, additional operational information available to PSE, or the way call periods are determined in practice.
Comparing the three 2026 capacity market call days
The three events occurred under quite different system conditions. To compare them consistently, I use a common window of 17:00–22:00 on all three days — the union of the three call windows. This avoids a confounding effect from call duration: averaging a two-hour call and a five-hour call over their respective windows would compare different sections of the evening ramp and could make call duration itself look like a difference in system conditions.
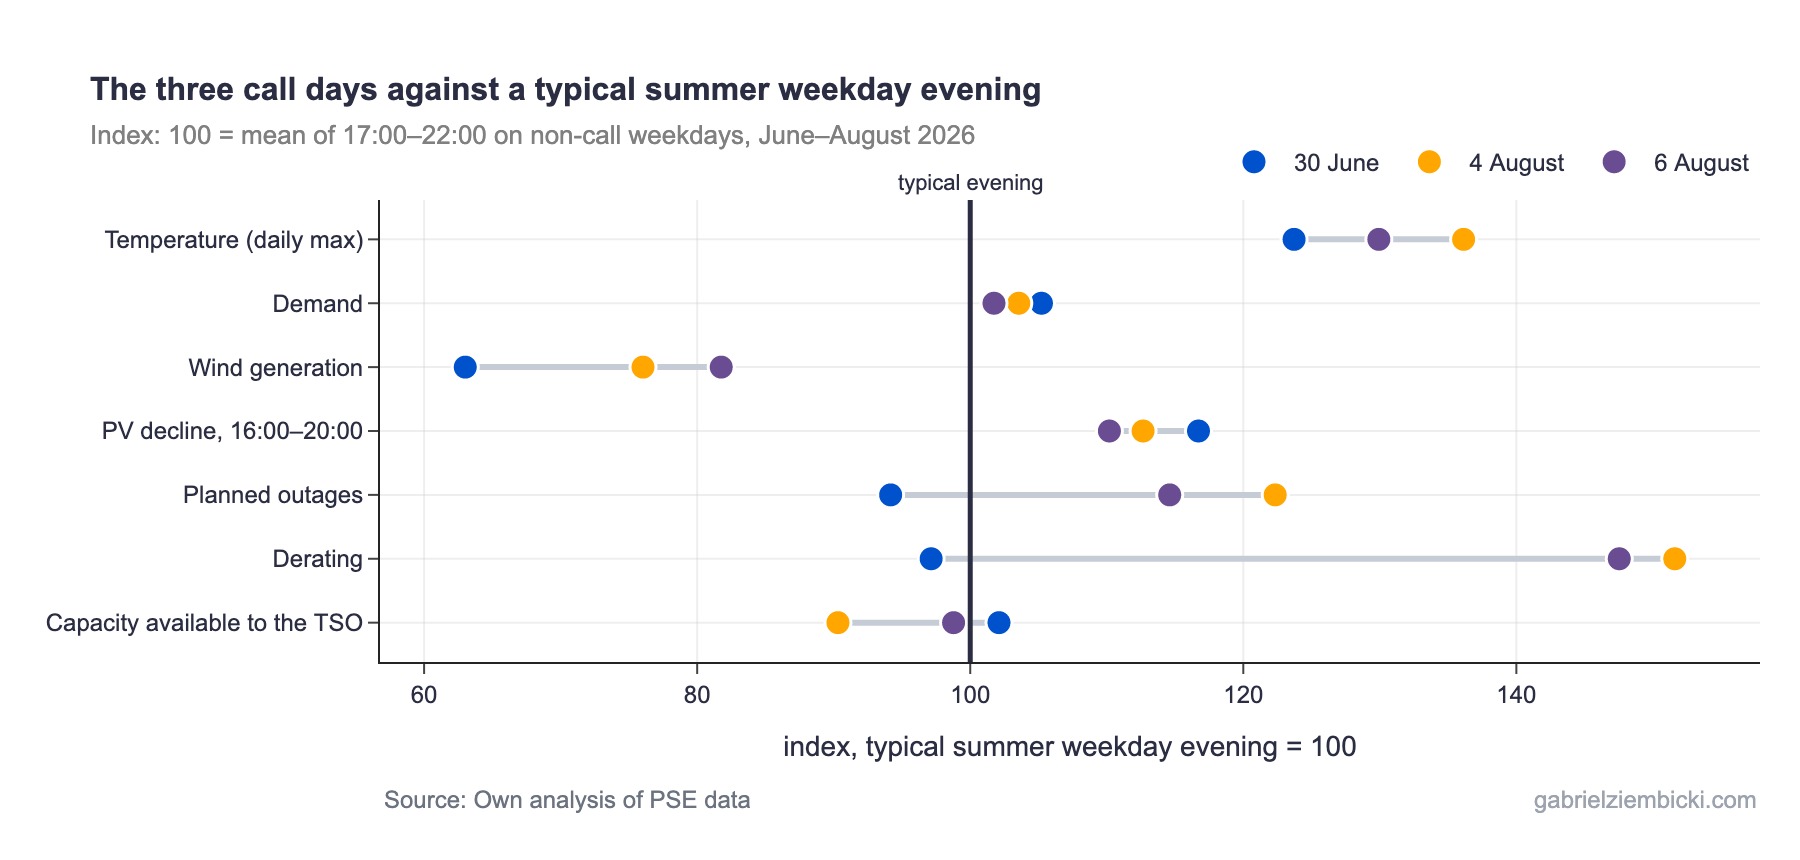
Common window, 17:00–22:00 (means over the window unless stated otherwise):
| Metric | 30 June | 4 August | 6 August |
|---|---|---|---|
| Daily maximum temperature, national mean (°C) | 27.9 | 30.7 | 29.3 |
| Demand, actual (GW) | 20.87 | 20.54 | 20.18 |
| Wind generation, actual (GW) | 1.21 | 1.46 | 1.57 |
| PV decline, 16:00–20:00 (GW) | 8.05 | 7.77 | 7.6 |
| Planned outages and shutdowns (GW) | 9.63 | 12.51 | 11.72 |
| Derating due to operating conditions (GW) | 2.39 | 3.73 | 3.63 |
| Capacity available to the TSO (GW) | 16.88 | 14.93 | 16.33 |
| Cross-border balance, actual (GW) | 0.02 | 1.53 | 1.14 |
| Average RCE (PLN/MWh) | 1277 | 1304 | 1277 |
| Minimum forecast margin above reserve (GW) | -1.68 | -0.97 | 0 |
30 June was primarily a demand-and-generation-profile problem. Planned outages were the lowest of the three days, at 9.6 GW, yet the minimum margin was the lowest, at −1,676 MW. Demand was the highest, at 20.9 GW; wind generation was the lowest, at 1.2 GW; cross-border support was almost zero, at 19 MW; and the evening PV decline was the steepest, at 8.0 GW.
4 August combined high demand with the greatest pressure on the supply side. It was the hottest of the three days, at 30.7 °C. Planned outages were the highest, at 12.5 GW, derating due to operating conditions reached 3.7 GW, and capacity available to the TSO was the lowest, at 14.9 GW. Net cross-border imports of around 1.5 GW offset part of the shortfall, leaving a minimum margin of −968 MW.
6 August looks quite different. It was the mildest of the three days, with the lowest demand, the highest wind generation and the smallest PV decline. Available capacity was close to the level observed on 30 June, while the minimum margin known as of 06:00 was approximately zero, at 4 MW. PSE nevertheless called five hours.
Forecast revisions before the announcement
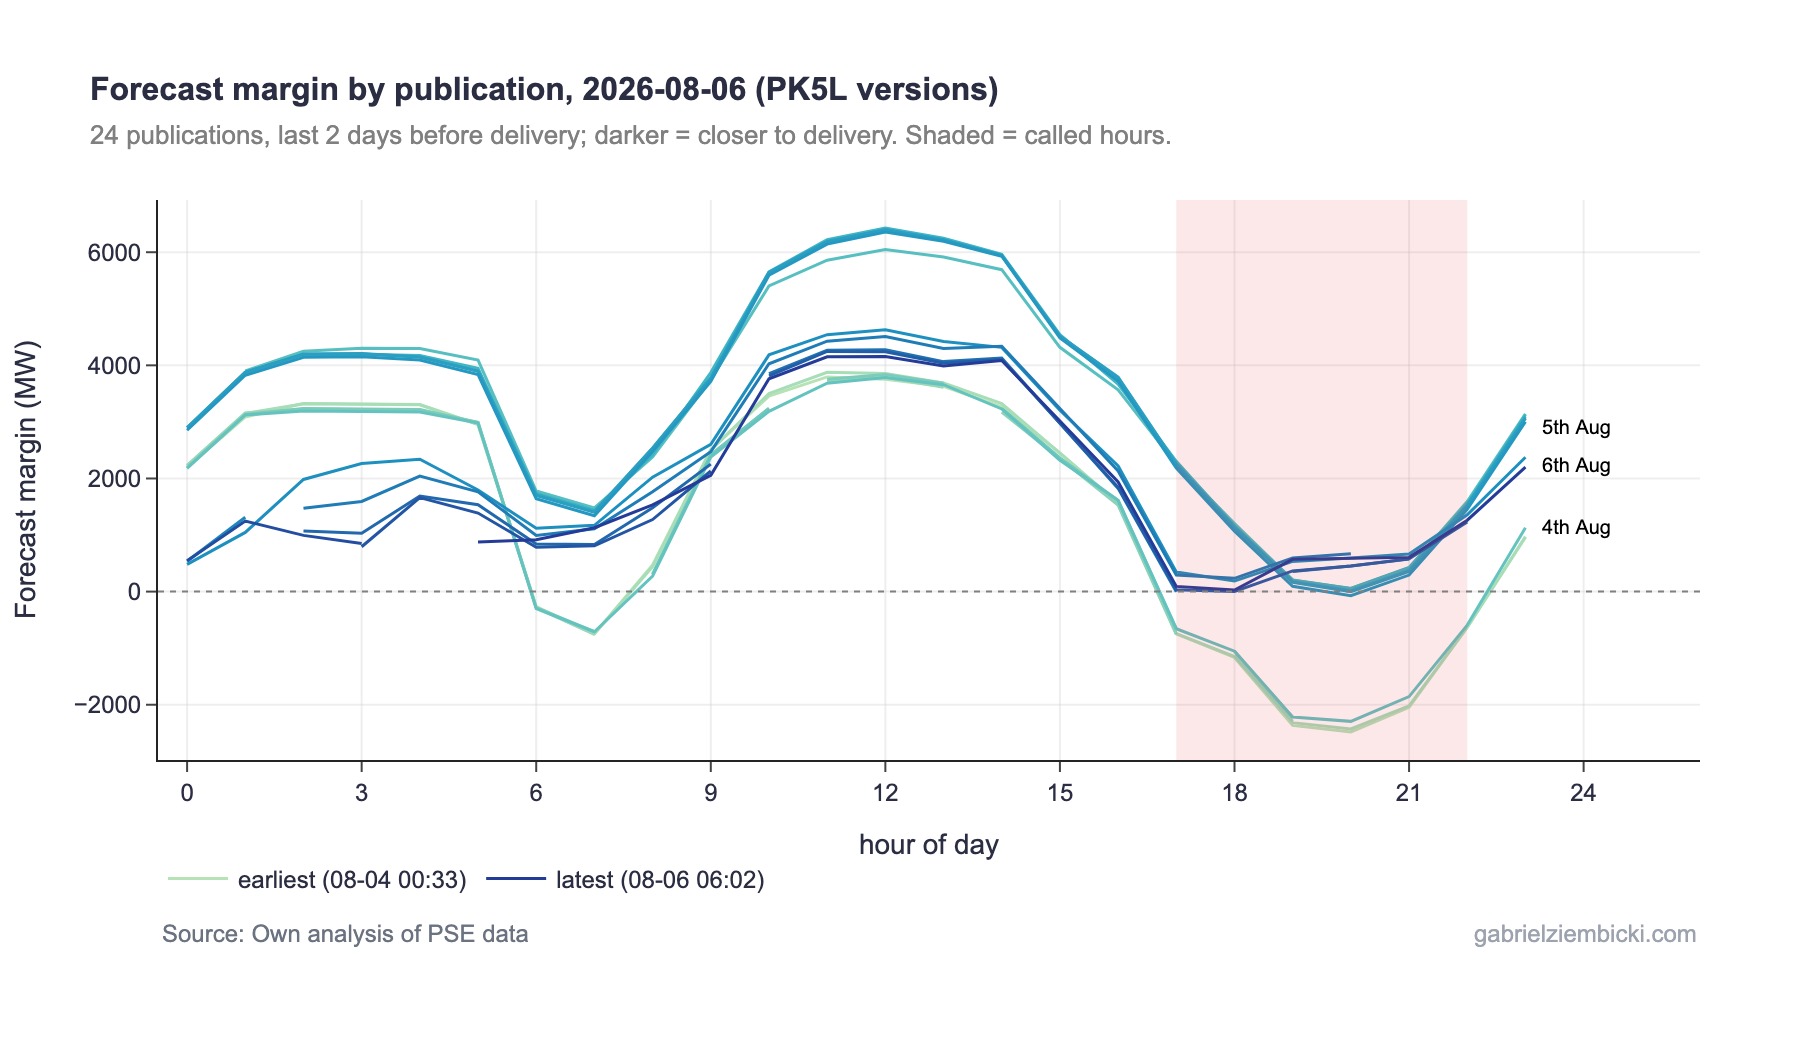
The 6 August event also illustrates how substantially the outlook can change as delivery approaches. Forecasts published on 4 August indicated a sizeable capacity deficit during the evening of 6 August. Publications on 5 August revised the margin markedly upward, leaving it positive through most of the eventual call window. Updates published on 6 August then revised the margin downward again, with the largest deterioration around 17:00–18:00.
The result is considerable forecast volatility even shortly before delivery — and another reason why a single overnight forecast cannot fully explain the final call decision.
What moved the margin, in megawatts
To understand why the three days became tight, I disaggregate the difference in margin into its individual components. Each call day is compared with a reference case: the median for the same hours on non-call weekdays in June–August 2026. Positive contributions widened the margin relative to the reference; negative contributions narrowed it.
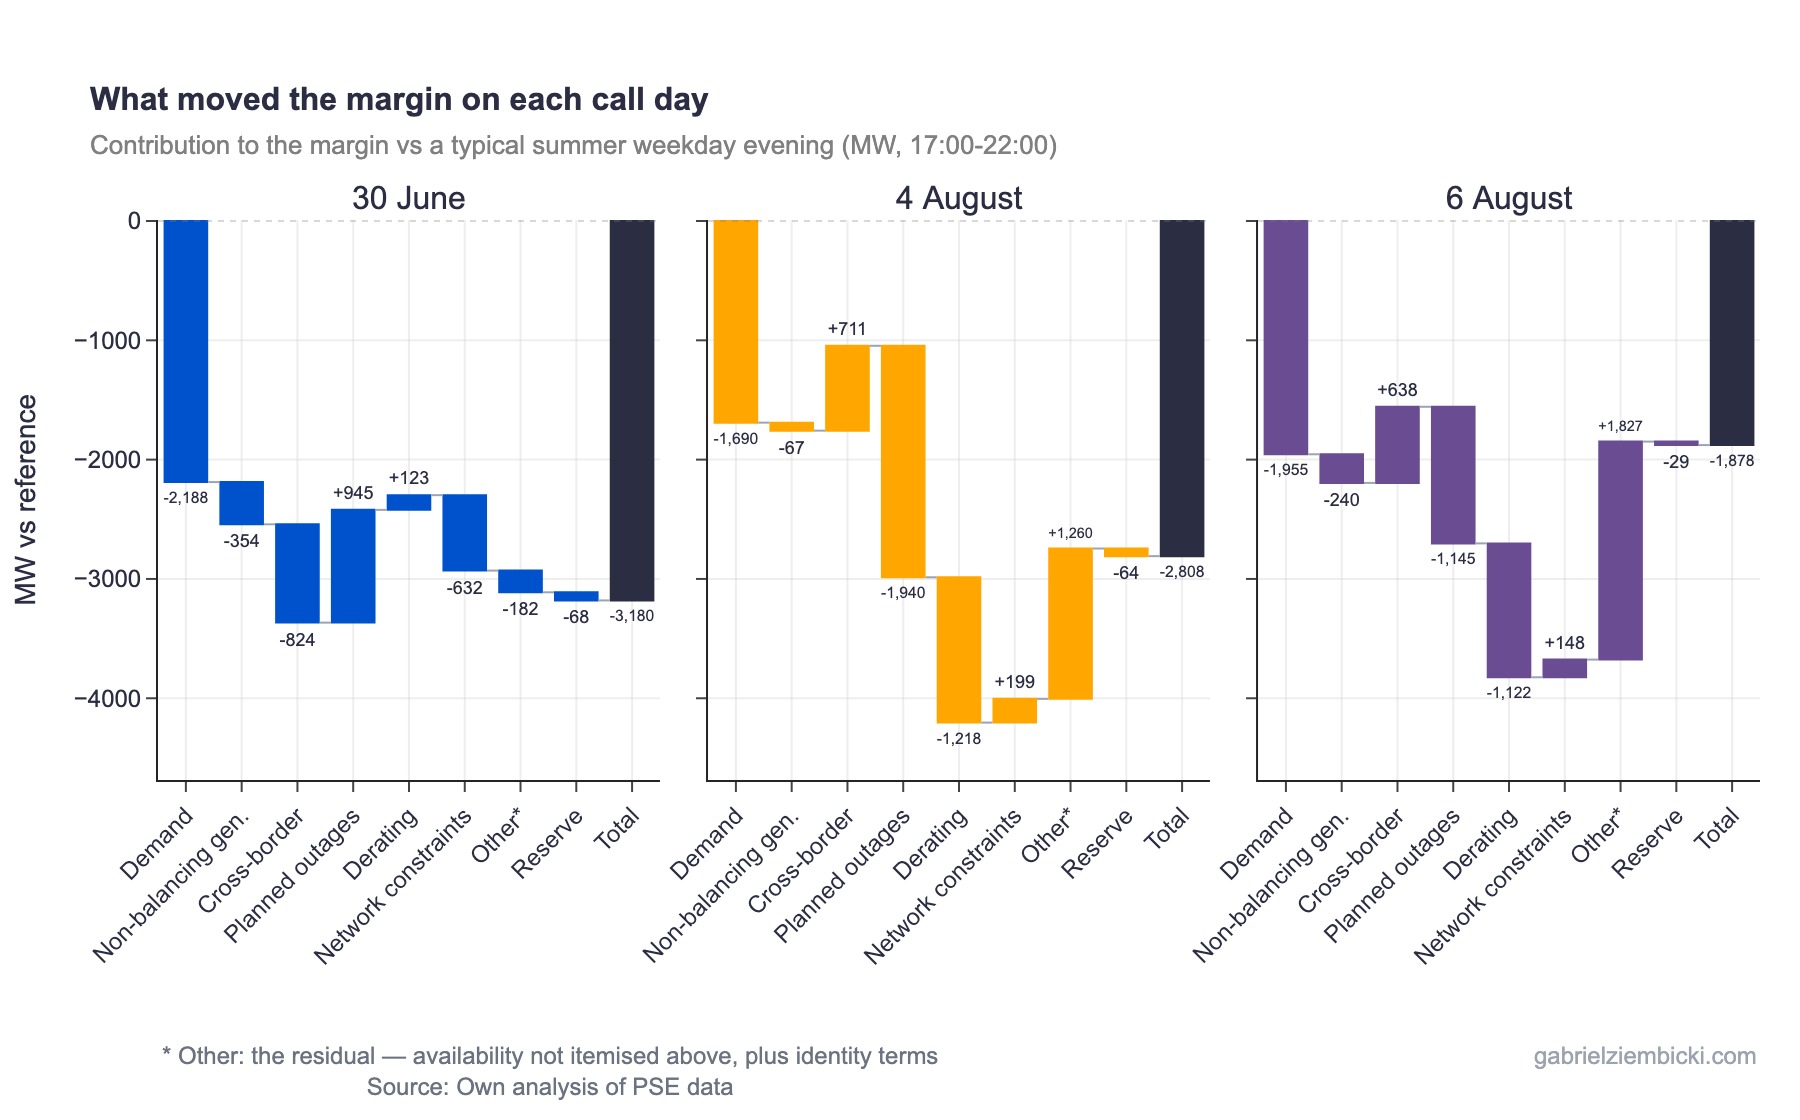
The decomposition separates the three days more sharply than the raw conditions do. On all three, demand is a large negative contribution — -2188 MW on 30 June, -1690 MW on 4 August and -1955 MW on 6 August — which is unsurprising, since a call day is by construction a busy evening. Beyond that, though, the three days have many differences.
On 30 June the supply side was actually better than a typical evening: planned outages contributed +945 MW and operating-condition derating +123 MW, because less plant was out than usual. The shortfall came from demand (-2188 MW), an unusually unhelpful cross-border balance (-824 MW) and network constraints (-632 MW). It was a day when the system was busy and poorly supported from outside, not one when the fleet was unavailable.
The two August days invert this. Planned outages and derating together removed over 3 GW on 4 August ({AUG04C_PLANNED} and -1218 MW) and over 2 GW on 6 August (-1145 and -1122 MW) relative to a normal evening, while imports _helped on both days (+711 and +638 MW). These were availability events, and that is the clearest structural difference the three calls reveal.
Stressed days when PSE did not call
Every condition observed on a call day — heat, low wind, a steep solar decline, heavy maintenance or a thin margin — can also occur on days without a call. Comparing the call days with these near misses helps distinguish the normal background of a Polish summer from the conditions that coincide with a capacity market call.
Tight margins without a call
Knowing that the called hours were among the tightest hours of their respective days does not tell us how unusual they were in absolute terms. For that, the call days need to be compared with every other capacity-obligation hour in the June–August 2026 study window.
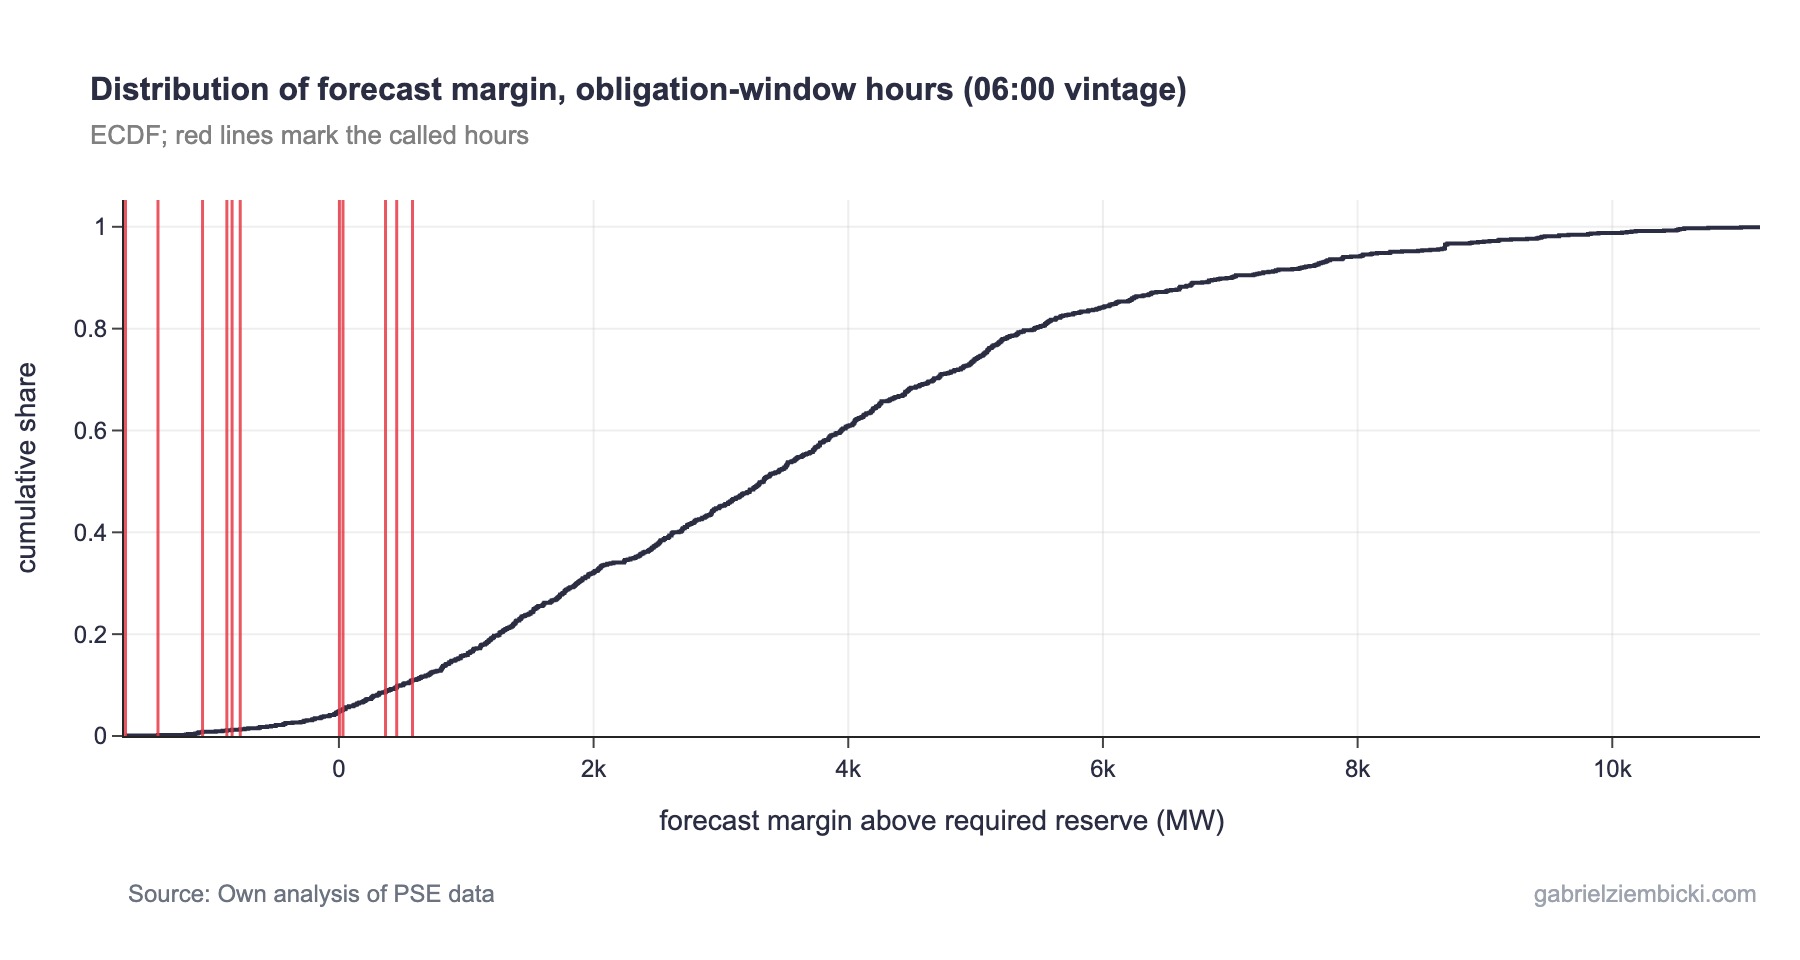
The median capacity-obligation hour carries 3335 MW of margin. The called hours sit at or below 578 MW, placing them in the bottom 11% of the period.
How often Polish summer evenings meet the call condition
The heatmap below shows the entire study window by day and hour, making it possible to see how frequently tight conditions occurred during summer evenings.
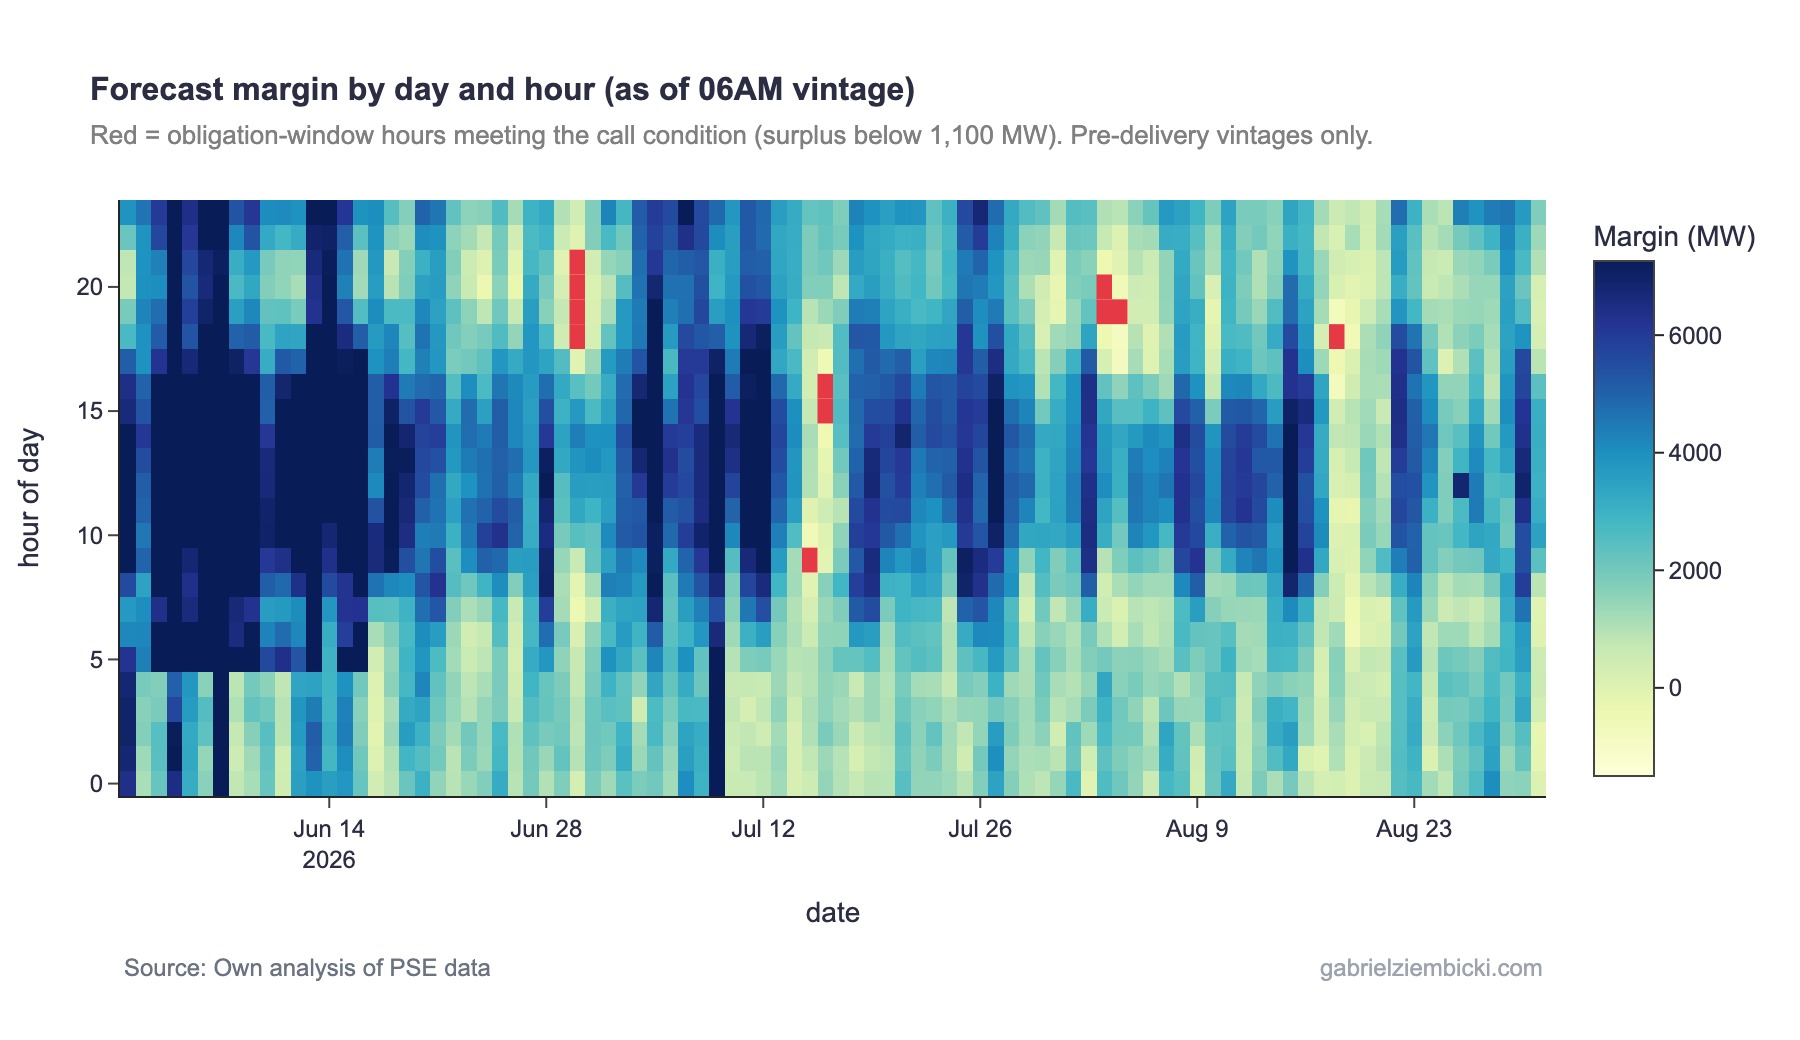
The red cells make a point that the three call days on their own cannot. Across the study window the formal condition — a capacity-obligation hour with the surplus available to the TSO below the 1,100 MW threshold — was met in 11 hours spread over 6 days, yet calls were declared on only three of those days. Hours that satisfy the published trigger are therefore considerably more common than calls, and they are not confined to the evening ramp.
The mismatch runs in both directions, which is the more telling part. Of the 11 hours PSE actually called, only some met the formal condition. For example, On 6 August, the longest call declared to date, every called hour carried a positive forecast margin, from +4 to +578 MW. Part of this gap is simply forecast revision: PSE keeps updating the plan through the morning and decides on information later than the overnight vintage used here, and Figure 5 shows how much the 6 August evening moved between publications. The remainder is discretion. The regulation lets PSE refrain from calling when it judges that demand coverage is not at risk, and 6 August shows the converse — that it may call when the published arithmetic alone would not compel it.
The pattern suggests a broader hypothesis. Poland’s outage calendar developed around a historically winter-peaking system: demand peaked on cold winter days, summer provided more system capacity buffer, and maintenance could therefore be concentrated in the warmer months. The system is changing. Growing cooling demand has increased summer loads, while 26 GW of solar capacity has shifted the tightest part of some summer days towards the evening, as PV production declines while demand remains elevated.
Three calls are far too few to establish this as the explanation, but the 2026 events are consistent with it. The emerging issue may be less a shortage of installed capacity in August than a shortage of available capacity at the right hours. If so, maintenance scheduling, operational availability and the evening renewable ramp deserve as much attention as headline installed capacity.
Methodology and data
System data. PSE coordination plans covering 1 June to 31 August 2026. The analysis focuses on the three capacity market calls declared during this period.
Calls. Capacity market call periods and announcement times published by PSE and compiled for this analysis.
Weather. Measured temperature from ERA5 reanalysis.
Factor contributions. Differences in the components of the margin identity between each call day and the median for the same hours on non-call weekdays in June–August 2026, using the corresponding overnight forecast vintage.
Get new posts by email
Empirical analysis of Poland's power markets and the energy transition, delivered when new posts go live. No spam.
More posts

How Residual Load Shapes Wholesale Electricity Prices in Poland
Residual load — demand minus wind and solar — is the single best lens on Poland wholesale power prices from 2020 to 2025. Year-by-year evolution, the rise of negative prices, and the month × hour price-sensitivity surface that anchors what-if analysis.
How much do Polish renewables actually earn? Solar and wind capture prices explained
What a MWh of Polish solar and wind actually earns, measured through capture price and capture factor. This post tracks how those numbers have moved since 2020, why wind and solar diverge, and what it means for project economics.
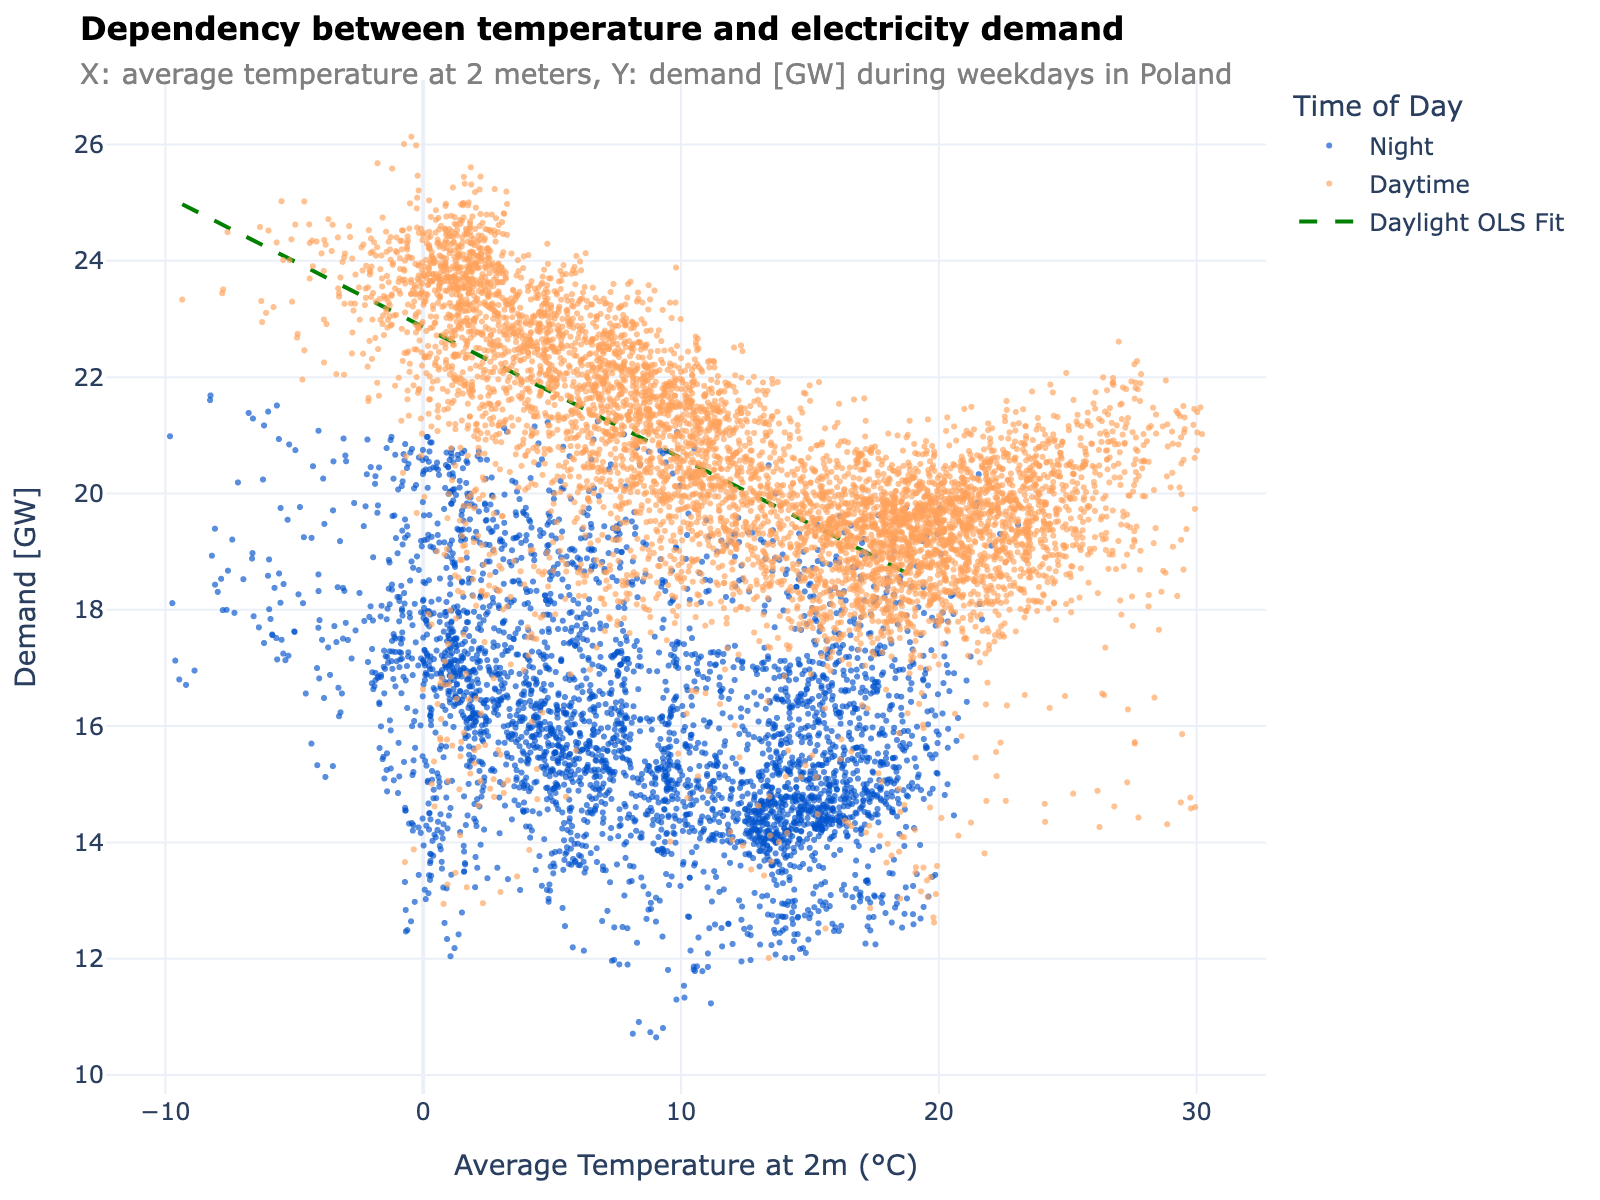
Poland's electricity demand: what temperature and ramps tell us about system stress
Demand in Poland follows a clean two-regime temperature curve with a comfort minimum at 16.5°C and a heating-side slope of 0.213 GW/°C. Residual-load P99 1-hour ramps reached 3.22 GW in 2024–2025 and will likely grow further with PV. A quantitative look at both.